PhenoCams are cameras designed specifically for tracking the timing of when plants grow buds, leaf out, flower, fruit and die back, the science known as plant phenology. In Abisko, SITES is operating a PhenoCam which is programmed to take pictures towards Mount Nuolja several times per day. The concept of repeat photography has been increasingly used to continuously monitor the foliage and canopy changes mainly because of its low cost, high temporal resolution, high-quality imagery, and automatic operation. SITES Spectral has these cameras set up at 8 different locations across Sweden taking pictures of different plants in an ecosystem.
PhenoCams record the amount of green (G), red (R), and blue (B) being reflected from those plants throughout the season and the seasonal trends of this color information (digital numbers; DN). Using digital repeat photography scientists can track the seasonal changes in plant development stages. For example, as plants turn green in the spring, the amount of brightness of green in the image increases, and when the plant turns red in the fall, the camera will record that too. The relative image brightness for the green channel over the overall image brightness (i.e., a total of RGB DN) is called the Green Chromatic Coordinate (GCC) while the same with the red channel is defined as the Red Chromatic Coordinate (RCC). These two indices have been extensively used to extract information about phenology. Plotting the time series of GCC or RCC over the years can indicate when the trees begin to turn green, when they are at their greenest, when the leaves begin to turn red, when they are the reddest, and when the leaves start to fall or the trees die back for the winter. The continuous recording of such data over time makes it possible to compare the dates of plants turning green in the spring and dying back and losing their leaves in the fall, to see if the dates change significantly from year to year. To demonstrate this, the images collected between 2015-2020 using the PhenoCam located at Abisko Scientific Research Station (68°21'16" N, 18°48'57" E) were used. A region of interest, which represents the subalpine birch forest, was defined (yellow polygon, Figure 1) to extract the change and plot the change in redness over the study period.
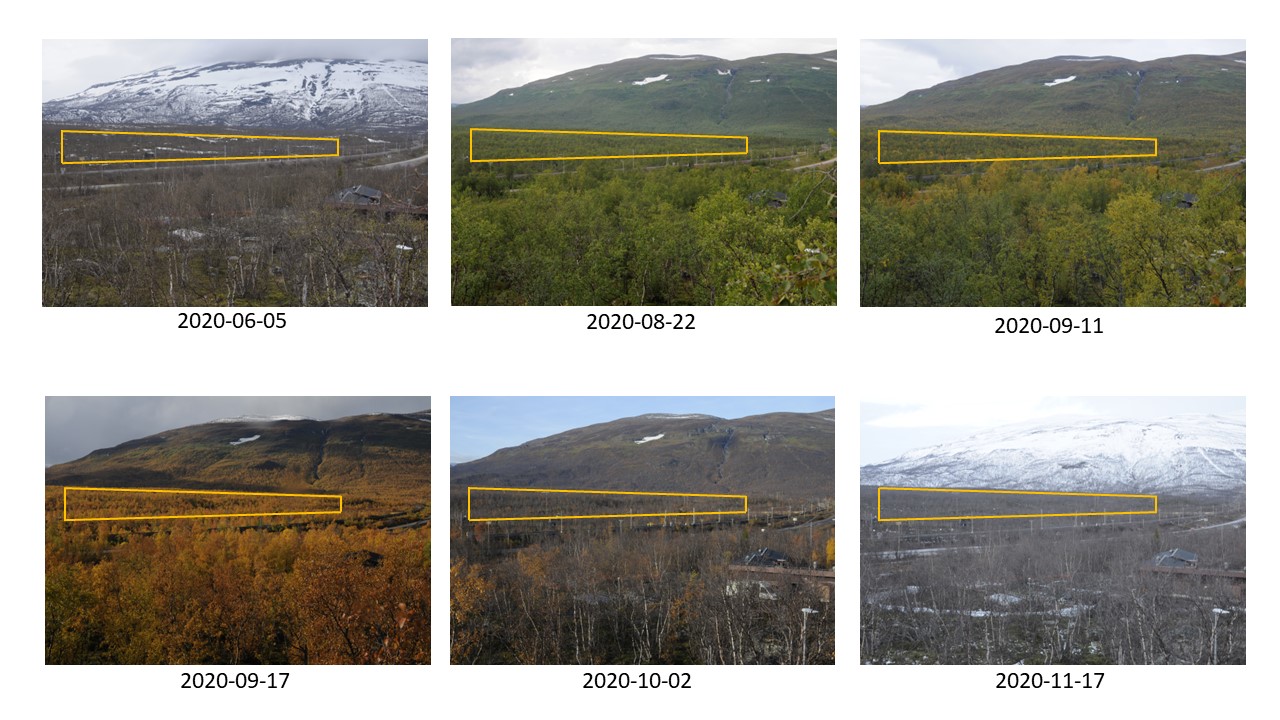
The daily change in RCC values throughout the study period is shown in the plot below (Figure 2). The date when the smoothed RCC reached the maximum in spring is defined as the Start of Season, and the maximum of the RCC curve in fall (dash-dot vertical line) is the end of the season (EOS) respectively. Only EOS is marked in the plots as the focus here is to extract and compare when the leaves on the trees are the reddest and if there are any changes in the EOS date throughout the study period.
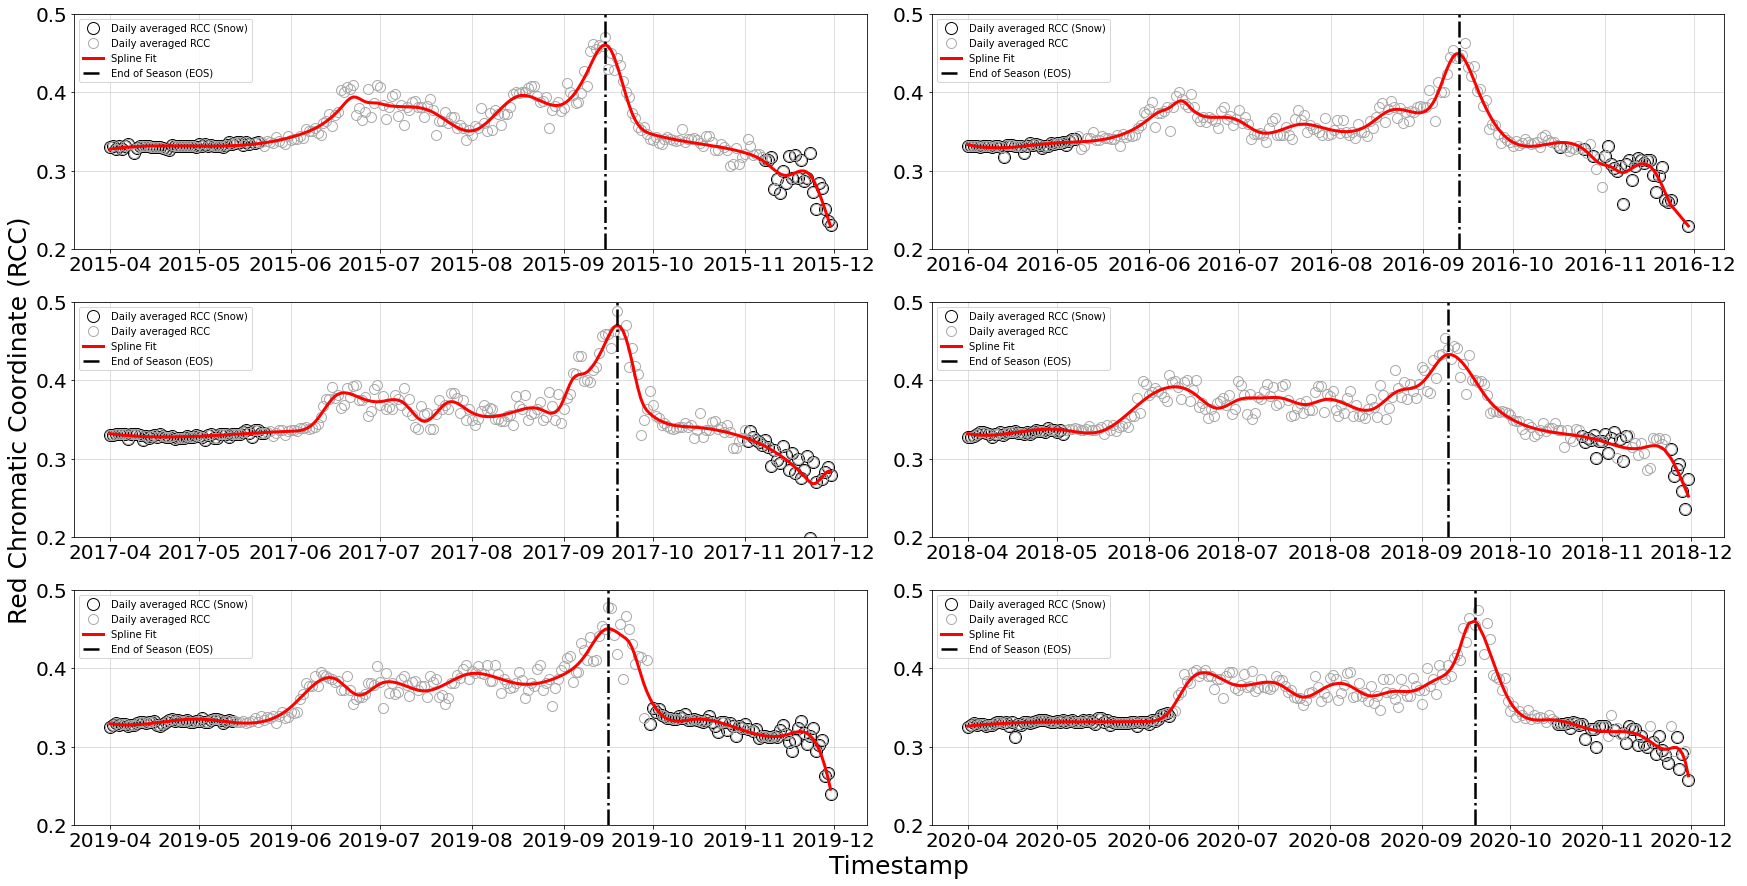
The EOS date across the study period varied between 1 - 6 days in general, except for the year 2018 when the trees turned red a few days earlier than normal. The timing of various plant life cycle events such as the EOS helps us understand how external factors like day length, temperature, and precipitation impact vegetation. We foresee more interesting results as the time series from SITES Spectral grow each year.