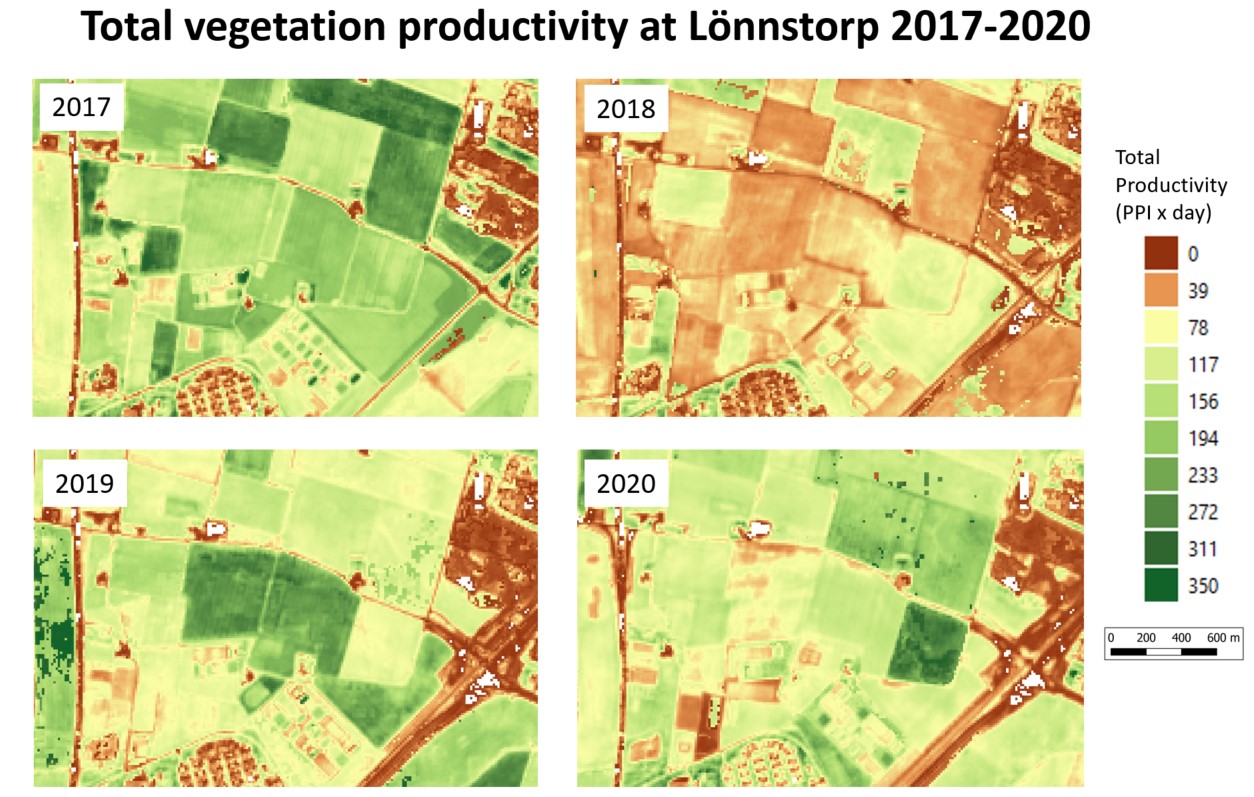
Ongoing work by SITES spectral uses satellites to give researchers a broad spatial view of vegetation conditions at SITES stations. This work generates data layers describing vegetation productivity and phenology for 20 x 20 km areas. Layer data ready for inclusion in GIS databases will be distributed in analysis-ready format, in the Swedish reference system. The data show the seasonal development of green vegetation and can be useful for monitoring vegetation’s response to variations in weather, human influence, and other factors. Below is an example of an agricultural area at Lönnstorp station, showing annual variations in vegetation productivity between 2017 and 2020. Note the strong decrease in productivity in 2018 in response to the drought.
The data source is the Copernicus HR-VPP, which stems from research at Lund University. You can find more information about the data on the Copernicus website
By 2022, SITES Spectral will generate vegetation productivity and phenology from satellite observations for all SITES stations!