background_mobile_2

New product for 3D display of SITES drone data

3D RGB drape rendered as .gif file, Miellejohka, Abisko Scientific Research Station. A high resolution version can be downloaded further down. 3D RGB drape rendered as .gif file, Miellejohka, Abisko Scientific Research Station. A high resolution version can be downloaded further down.
A new dataset called ‘3D RGB Drape’ is defined and tested for UAV (drone) images available for SITES stations. Shangharsha Thapa from SITES Spectral describes this new product.

Images from Unmanned Aerial Vehicle (UAV) present a way to generate accurate and high-resolution topographic products such as orthomosaics (combination of aerial photograph or satellite imagery of a large area) and digital surface models (DSMs) in a fast and economical way. However, the orthomosaics and DSMs that are obtained after processing the UAV images may be quite heavy in terms of file size, which makes them challenging to disseminate to users. A 2D orthomosaic and elevation map can be a very good way of presenting the land use and topography within the flight area (Figure 1). However, to prepare and disseminate such maps, one must have prior basic knowledge of GIS and also access to available GIS applications (such as ArcGIS and QGIS).
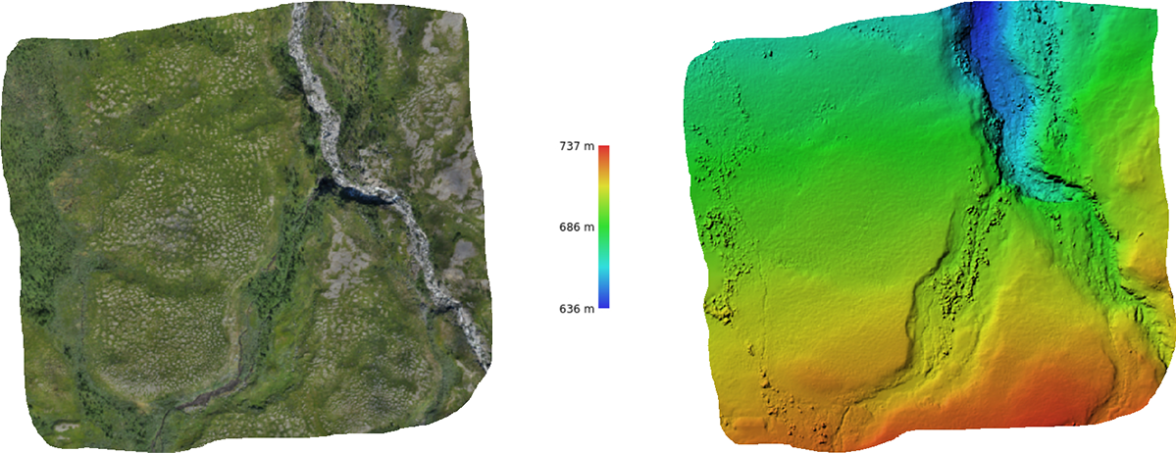
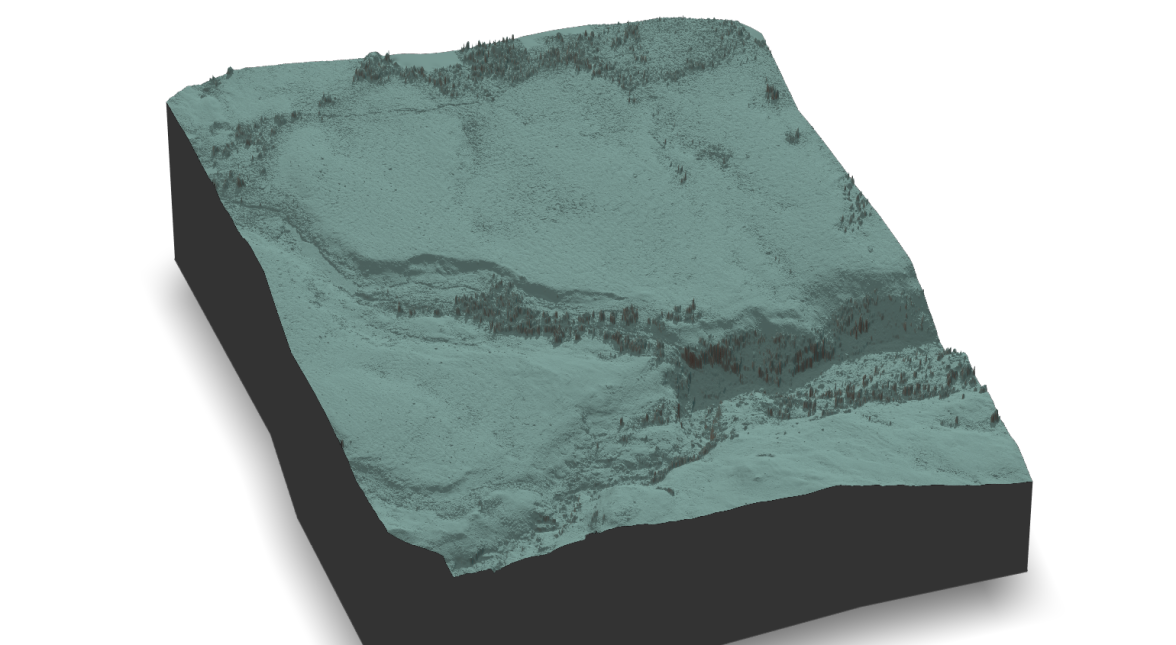
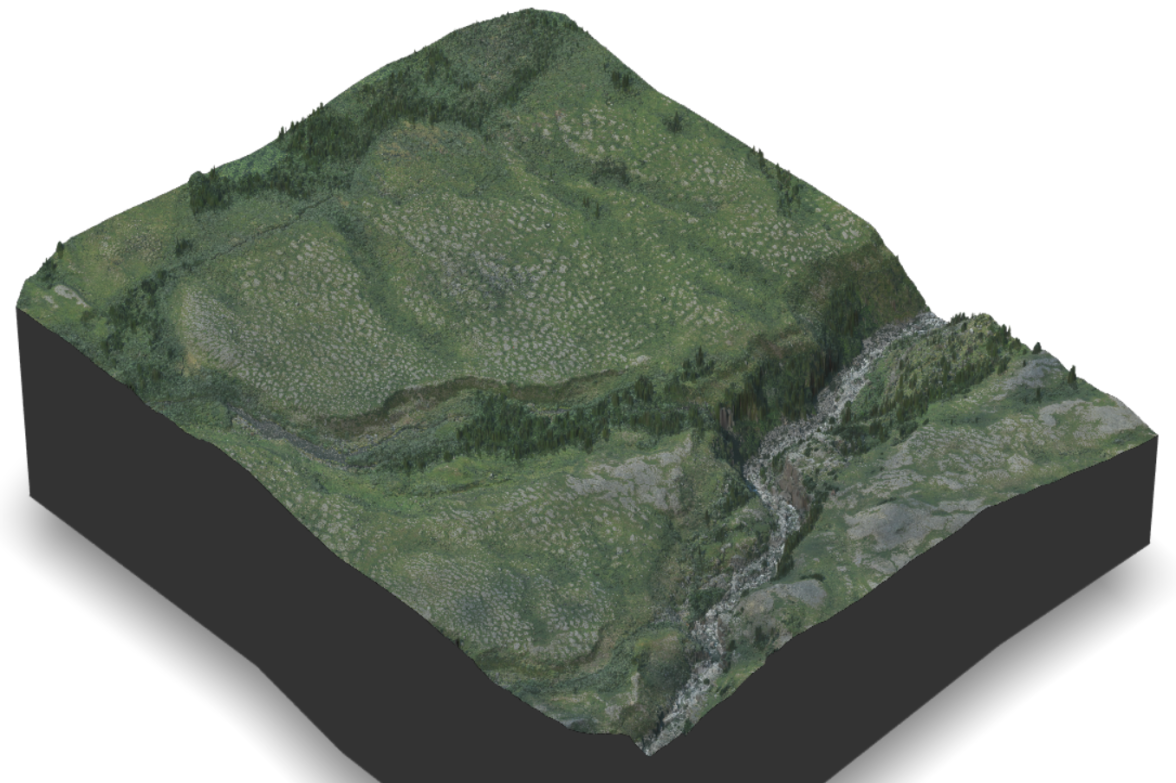
Figure 1: RGB Orthomosaic (Left) and DEM (Right) of UAV flight conducted at Miellejohka location, Abisko Scientific Research Station on 2018-07-28.
So, to make the data visualization and dissemination simple, realistic, easy to handle, and GIS platform-independent, a new dataset called ‘3D RGB Drape’ has been defined and tested for UAV images available for SITES stations. In this new dataset, the RGB orthomosaics are draped on top of the 3D surfaces (digital terrain model, DTM) to give  a more realistic appearance.

There is a wide range of techniques or applications that offer 3D solutions. Qgis2threejs, Blender GIS, Mayavi, Rayshader, and ArcGIS are some examples. The first four packages are open-source platforms, while the last one is commercial. All these platforms were tested to generate 3D RGB drapes, and it was found that the R-package Rayshader offered the best results, both in terms of quality and high-resolution data handling.

Rayshader is an open-source package for producing 2D and 3D hill shaded maps of elevation matrices using a combination of raytracing, spherical texture mapping, overlays, and ambient occlusion (adopted from Dr. Tyler Morgan’s website). The process of rendering a 3D scene begins with plotting an elevation matrix. A hillshade is generated and plotted from the elevation matrix with a Z-scale factor ranging from 0.05 to 0.2 depending on the elevation variation within the area. The shadow layers are successively added on the plotted hillshade, and the result is printed on the screen with OpenGL (Figure 2).
Figure 2: Hillshade for DEM of Miellejohka location, Abisko Scientific Research Station.
Now, that the 3D hill shaded surface is ready, it is time for overlaying RGB orthomosaics on top of it. Before draping the orthomosaic, one must ensure that the overlay image dimensions match the elevation data dimensions. Below is an example of one of the static rendered snapshots of orthomosaics from the flight area at Abisko, but locally one can interact with the 3D plot at this stage.
Figure 3: 3D RGB Drape of Miellejohka UAV flight area, Abisko Scientific Research Station.
One of the most eye-catching features of Rayshader is its ability to export the rendered 3D surface into a different file format such as .mp4, .obj, and .gif. An .obj file is a standard 3D image format that can be viewed by various 3D image viewers. There are several functions available within the Rayshader package for the creation of any of these file formats. The function allows capturing the user-defined number of snapshots of the rendered 3D from different angles. All these snapshots are looped to stitch them into an .mp4, .obj, or .gif file (Figure 4). The .gif file is easier to attach to websites for visualization, in PowerPoint presentations, and has several different applications. With the use of a simple few lines of code, one can come up with exciting 3D maps to help bring the UAV photogrammetric products to life.

News Archive

Latest News