
Phenological observations are made on birch, spruce and pine trees as well as on bilberry and lingonberry bushes. Shoot development, autumn leaf colouring, leaf felling and flowering are followed as part of the phenological observations. The monitoring programme started in 2006.
- Read more at SLU’s website: Phenology
- For data contact Ola Langvall (ola.langvall@slu.se).
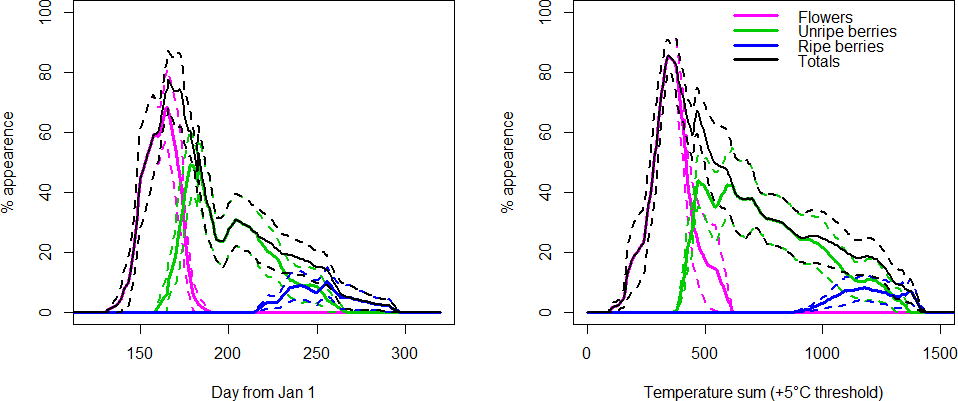 Relative number of flowers, unripe and ripe berries of lingon, according to phenology assessments made in Asa between 2006 and 2020. Lines represent the 15-year average (solid) and standard error (dashed) numbers. Left panel show number of flowers, unripe and ripe berries vs. date and right panel vs. temperature sum, calculated from air temperature at standard height from the meteorological station in Asa.
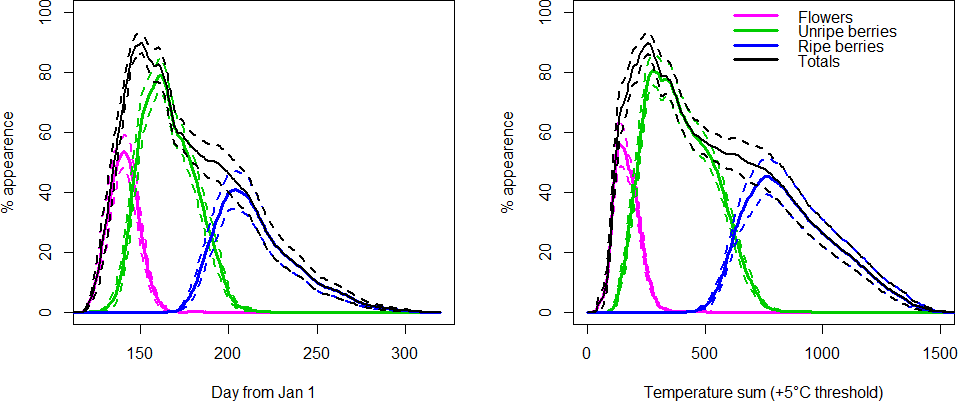
Relative number of flowers, unripe and ripe berries of bilberry, according to phenology assessments made in Asa between 2006 and 2020. Lines represent the 15-year average (solid) and standard error (dashed) numbers. Left panel show number of flowers, unripe and ripe berries vs. date and right panel vs. temperature sum, calculated from air temperature at standard height from the meteorological station in Asa.
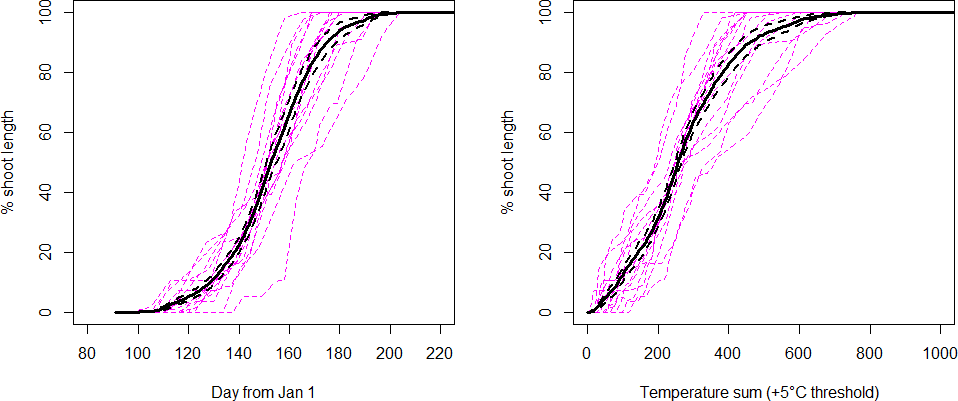
Shoot development of Norway spruce, according to phenology assessments made in Asa between 2006 and 2020. Pink dashed lines indicate single year development, black lines represent the 15-year average (solid) and standard error (dashed) shoot development. Left panel show shoot development vs. date and right panel vs. temperature sum, calculated from air temperature at standard height from the meteorological station in Asa.
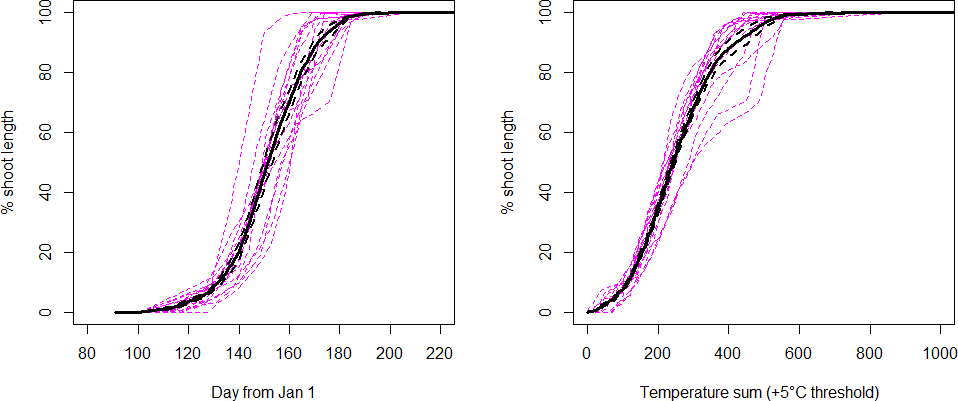
Shoot development of Scots pine, according to phenology assessments made in Asa between 2006 and 2020. Pink dashed lines indicate single year development, black lines represent the 15-year average (solid) and standard error (dashed) shoot development. Left panel show shoot development vs. date and right panel vs. temperature sum, calculated from air temperature at standard height from the meteorological station in Asa.